Catalytic subunit of AMP-activated protein kinase (AMPK), an energy sensor protein kinase that plays a key role in regulating cellular energy metabolism. In response to reduction of intracellular ATP levels, AMPK activates energy-producing pathways and inhibits energy-consuming processes: inhibits protein, carbohydrate and lipid biosynthesis, as well as cell growth and proliferation. AMPK acts via direct phosphorylation of metabolic enzymes, and by longer-term effects via phosphorylation of transcription regulators. Also acts as a regulator of cellular polarity by remodeling the actin cytoskeleton; probably by indirectly activating myosin. Regulates lipid synthesis by phosphorylating and inactivating lipid metabolic enzymes such as ACACA, ACACB, GYS1, HMGCR and LIPE; regulates fatty acid and cholesterol synthesis by phosphorylating acetyl-CoA carboxylase (ACACA and ACACB) and hormone-sensitive lipase (LIPE) enzymes, respectively. Regulates insulin-signaling and glycolysis by phosphorylating IRS1, PFKFB2 and PFKFB3. AMPK stimulates glucose uptake in muscle by increasing the translocation of the glucose transporter SLC2A4/GLUT4 to the plasma membrane, possibly by mediating phosphorylation of TBC1D4/AS160. Regulates transcription and chromatin structure by phosphorylating transcription regulators involved in energy metabolism such as CRTC2/TORC2, FOXO3, histone H2B, HDAC5, MEF2C, MLXIPL/ChREBP, EP300, HNF4A, p53/TP53, SREBF1, SREBF2 and PPARGC1A. Acts as a key regulator of glucose homeostasis in liver by phosphorylating CRTC2/TORC2, leading to CRTC2/TORC2 sequestration in the cytoplasm. In response to stress, phosphorylates 'Ser-36' of histone H2B (H2BS36ph), leading to promote transcription. Acts as a key regulator of cell growth and proliferation by phosphorylating TSC2, RPTOR and ATG1/ULK1: in response to nutrient limitation, negatively regulates the mTORC1 complex by phosphorylating RPTOR component of the mTORC1 complex and by phosphorylating and activating TSC2. In response to nutrient limitation, promotes autophagy by phosphorylating and activating ATG1/ULK1. In that process also activates WDR45. In response to nutrient limitation, phosphorylates transcription factor FOXO3 promoting FOXO3 mitochondrial import (By similarity). AMPK also acts as a regulator of circadian rhythm by mediating phosphorylation of CRY1, leading to destabilize it. May regulate the Wnt signaling pathway by phosphorylating CTNNB1, leading to stabilize it. Also has tau-protein kinase activity: in response to amyloid beta A4 protein (APP) exposure, activated by CAMKK2, leading to phosphorylation of MAPT/TAU; however the relevance of such data remains unclear in vivo. Also phosphorylates CFTR, EEF2K, KLC1, NOS3 and SLC12A1.
Description
Rabbit polyclonal antibody to AMPK alpha
Applications
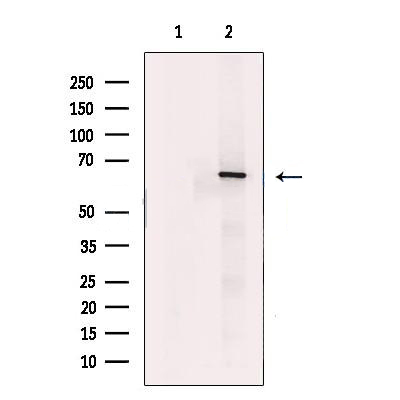
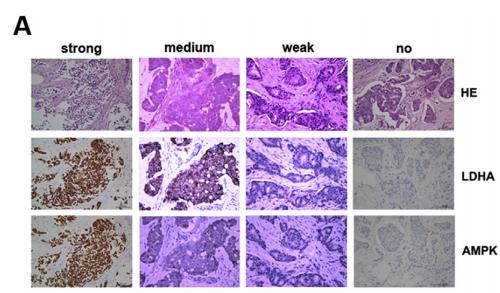
WB, IF, ICC, IHC.
Immunogen
AMPK alpha Antibody detects endogenous levels of total AMPK alpha.
Reactivity
Human, Mouse, Rat.
可预测:Zebrafish(88%), Bovine(%), Sheep(%), Rabbit(%), Dog(%), Chicken(%)
Molecular weight
63kDa; 64kD,62kD(Calculated).
Host species
Rabbit
Ig class
Immunogen-specific rabbit IgG
Purification
Antigen affinity purification
Full name
AMPK alpha
Synonyms
5 AMP activated protein kinase alpha 1catalytic subunit; 5 AMP activated protein kinase catalytic alpha 1 chain; 5' AMP activated protein kinase catalytic subunit alpha 1; 5'-AMP-activated protein kinase catalytic subunit alpha-1; AAPK1; AAPK1_HUMAN; ACACA kinase; acetyl CoA carboxylase kinase; AI194361; AI450832; AL024255; AMP -activate kinase alpha 1 subunit; AMP-activated protein kinase, catalytic, alpha -1; AMPK 1; AMPK alpha 1; AMPK alpha 1 chain; AMPK; AMPK subunit alpha-1; AMPK1; AMPKa1; AMPKalpha1; C130083N04Rik; cb116; EC 2.7.11.1; HMG CoA reductase kinase; HMGCR kinase; hormone sensitive lipase kinase; Hydroxymethylglutaryl CoA reductase kinase; im:7154392; kinase AMPK alpha1; MGC33776; MGC57364; OTTHUMP00000161795; OTTHUMP00000161796; PRKAA 1; PRKAA1; Protein kinase AMP activated alpha 1 catalytic subunit; SNF1-like protein AMPK; SNF1A; Tau protein kinase PRKAA1; wu:fa94c10; 5'-AMP-activated protein kinase catalytic subunit alpha-2; AAPK2_HUMAN; ACACA kinase; Acetyl-CoA carboxylase kinase; AMPK alpha 2 chain; AMPK subunit alpha-2; AMPK2; AMPKa2; AMPKalpha2; HMGCR kinase; Hydroxymethylglutaryl-CoA reductase kinase; PRKAA; PRKAA2; Protein kinase AMP activated alpha 2 catalytic subunit; Protein kinase AMP activated catalytic subunit alpha 2;
Storage
Rabbit IgG in phosphate buffered saline , pH 7.4, 150mM NaCl, 0.02% sodium azide and 50% glycerol. Store at -20 °C. Stable for 12 months from date of receipt.
Swissprot
Q13131 | P54646


 产品订购:
产品订购:
 渠道电话:
渠道电话: