Is able to inhibit all four classes of proteinases by a unique 'trapping' mechanism. This protein has a peptide stretch, called the 'bait region' which contains specific cleavage sites for different proteinases. When a proteinase cleaves the bait region, a conformational change is induced in the protein which traps the proteinase. The entrapped enzyme remains active against low molecular weight substrates (activity against high molecular weight substrates is greatly reduced). Following cleavage in the bait region, a thioester bond is hydrolyzed and mediates the covalent binding of the protein to the proteinase.
Description
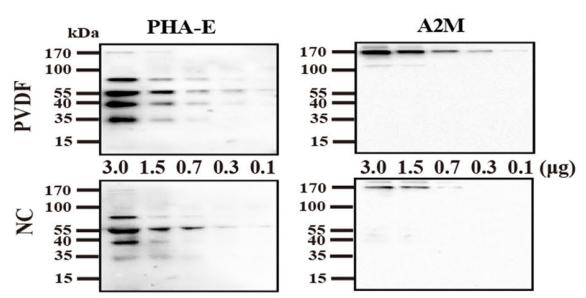
Rabbit polyclonal antibody to alpha 2 Macroglobulin/A2M
Applications
WB, IHC.
Immunogen
alpha 2 Macroglobulin/A2M Antibody detects endogenous levels of total alpha 2 Macroglobulin/A2M.
Reactivity
Human, Mouse.
Molecular weight
163kDa; 163kD(Calculated).
Host species
Rabbit
Ig class
Immunogen-specific rabbit IgG
Purification
Antigen affinity purification
Full name
alpha 2 Macroglobulin/A2M
Synonyms
A2m; A2MG_HUMAN; Alpha 2 M; Alpha 2M; Alpha-2-M; Alpha-2-macroglobulin; C3 and PZP-like alpha-2-macroglobulin domain-containing protein 5; CPAMD5; DKFZp779B086; FWP007; S863 7;
Storage
Rabbit IgG in phosphate buffered saline , pH 7.4, 150mM NaCl, 0.02% sodium azide and 50% glycerol. Store at -20 °C. Stable for 12 months from date of receipt.
Swissprot
P01023


 产品订购:
产品订购:
 渠道电话:
渠道电话: