This isozyme plays a key role in skeletal mineralization by regulating levels of diphosphate (PPi).
Description
Rabbit polyclonal antibody to Alkaline Phosphatase
Applications
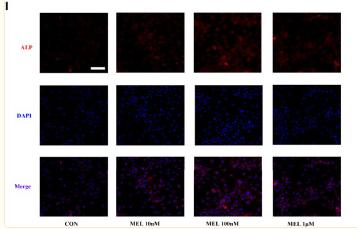
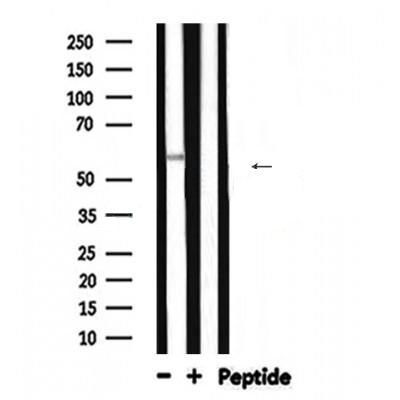
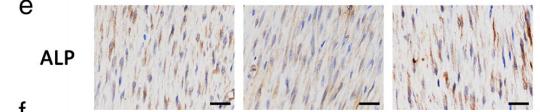
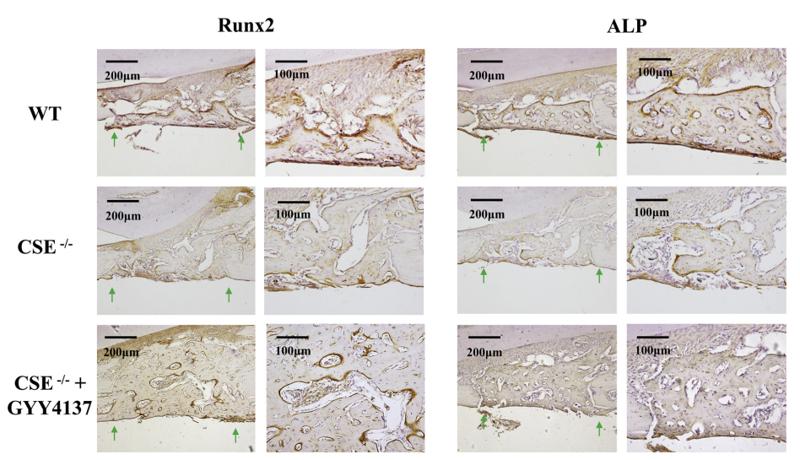
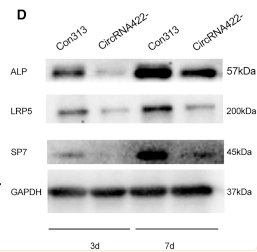
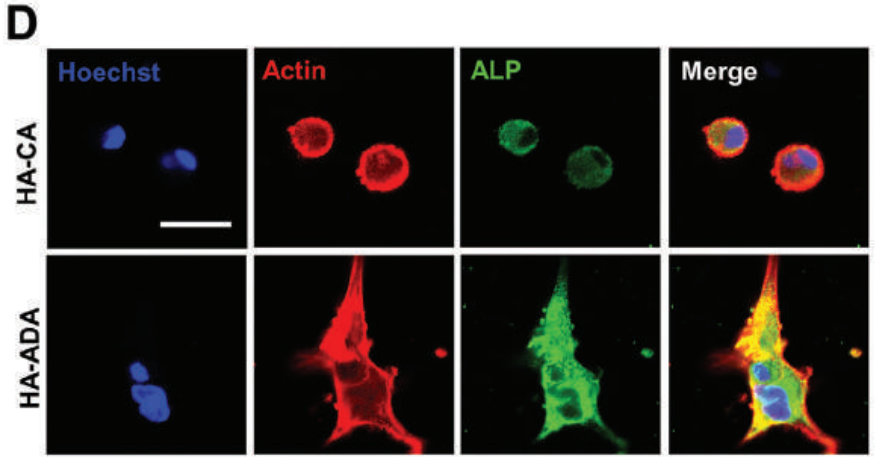
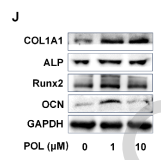
WB, IF, ICC, IHC.
Immunogen
ALPL Antibody detects endogenous levels of total ALPL.
Reactivity
Human, Mouse, Rat.
可预测:Pig(88%), Bovine(%), Horse(%), Sheep(%), Rabbit(%), Dog(%)
Molecular weight
57kDa; 57kD(Calculated).
Host species
Rabbit
Ig class
Immunogen-specific rabbit IgG
Purification
Antigen affinity purification
Full name
Alkaline Phosphatase
Synonyms
AKP2; Alkaline phosphatase liver/bone/kidney; Alkaline phosphatase liver/bone/kidney isozyme; Alkaline phosphatase tissue nonspecific isozyme; Alkaline phosphatase, tissue-nonspecific isozyme; Alkaline phosphomonoesterase; Alpl; AP TNAP; AP-TNAP; APTNAP; BAP; FLJ40094; FLJ93059; Glycerophosphatase; HOPS; Liver/bone/kidney type alkaline phosphatase; MGC161443; MGC167935; PHOA; PPBT_HUMAN; Tissue non specific alkaline phosphatase; Tissue nonspecific ALP; TNAP; TNSALP;
Storage
Rabbit IgG in phosphate buffered saline , pH 7.4, 150mM NaCl, 0.02% sodium azide and 50% glycerol. Store at -20 °C. Stable for 12 months from date of receipt.
Swissprot
P05186


 产品订购:
产品订购:
 渠道电话:
渠道电话: