AKT1 is one of 3 closely related serine/threonine-protein kinases (AKT1, AKT2 and AKT3) called the AKT kinase, and which regulate many processes including metabolism, proliferation, cell survival, growth and angiogenesis. This is mediated through serine and/or threonine phosphorylation of a range of downstream substrates. Over 100 substrate candidates have been reported so far, but for most of them, no isoform specificity has been reported. AKT is responsible of the regulation of glucose uptake by mediating insulin-induced translocation of the SLC2A4/GLUT4 glucose transporter to the cell surface (By similarity). Phosphorylation of PTPN1 at 'Ser-50' negatively modulates its phosphatase activity preventing dephosphorylation of the insulin receptor and the attenuation of insulin signaling (By similarity). Phosphorylation of TBC1D4 triggers the binding of this effector to inhibitory 14-3-3 proteins, which is required for insulin-stimulated glucose transport. AKT regulates also the storage of glucose in the form of glycogen by phosphorylating GSK3A at 'Ser-21' and GSK3B at 'Ser-9', resulting in inhibition of its kinase activity (By similarity). Phosphorylation of GSK3 isoforms by AKT is also thought to be one mechanism by which cell proliferation is driven (By similarity). AKT regulates also cell survival via the phosphorylation of MAP3K5 (apoptosis signal-related kinase). Phosphorylation of 'Ser-83' decreases MAP3K5 kinase activity stimulated by oxidative stress and thereby prevents apoptosis. AKT mediates insulin-stimulated protein synthesis by phosphorylating TSC2 at 'Ser-939' and 'Thr-1462', thereby activating mTORC1 signaling and leading to both phosphorylation of 4E-BP1 and in activation of RPS6KB1. AKT is involved in the phosphorylation of members of the FOXO factors (Forkhead family of transcription factors), leading to binding of 14-3-3 proteins and cytoplasmic localization. In particular, FOXO1 is phosphorylated at 'Thr-24', 'Ser-256' and 'Ser-319'. FOXO3 and FOXO4 are phosphorylated on equivalent sites. AKT has an important role in the regulation of NF-kappa-B-dependent gene transcription and positively regulates the activity of CREB1 (cyclic AMP (cAMP)-response element binding protein). The phosphorylation of CREB1 induces the binding of accessory proteins that are necessary for the transcription of pro-survival genes such as BCL2 and MCL1. AKT phosphorylates 'Ser-454' on ATP citrate lyase (ACLY), thereby potentially regulating ACLY activity and fatty acid synthesis (By similarity). Activates the 3B isoform of cyclic nucleotide phosphodiesterase (PDE3B) via phosphorylation of 'Ser-273', resulting in reduced cyclic AMP levels and inhibition of lipolysis (By similarity). Phosphorylates PIKFYVE on 'Ser-318', which results in increased PI(3)P-5 activity (By similarity). The Rho GTPase-activating protein DLC1 is another substrate and its phosphorylation is implicated in the regulation cell proliferation and cell growth. AKT plays a role as key modulator of the AKT-mTOR signaling pathway controlling the tempo of the process of newborn neurons integration during adult neurogenesis, including correct neuron positioning, dendritic development and synapse formation (By similarity). Signals downstream of phosphatidylinositol 3-kinase (PI(3)K) to mediate the effects of various growth factors such as platelet-derived growth factor (PDGF), epidermal growth factor (EGF), insulin and insulin-like growth factor I (IGF-I). AKT mediates the antiapoptotic effects of IGF-I (By similarity). Essential for the SPATA13-mediated regulation of cell migration and adhesion assembly and disassembly. May be involved in the regulation of the placental development (By similarity). Phosphorylates STK4/MST1 at 'Thr-120' and 'Thr-387' leading to inhibition of its: kinase activity, nuclear translocation, autophosphorylation and ability to phosphorylate FOXO3. Phosphorylates STK3/MST2 at 'Thr-117' and 'Thr-384' leading to inhibition of its: cleavage, kinase activity, autophosphorylation at Thr-180, binding to RASSF1 and nuclear translocation. Phosphorylates SRPK2 and enhances its kinase activity towards SRSF2 and ACIN1 and promotes its nuclear translocation. Phosphorylates RAF1 at 'Ser-259' and negatively regulates its activity. Phosphorylation of BAD stimulates its pro-apoptotic activity. Phosphorylates KAT6A at 'Thr-369' and this phosphorylation inhibits the interaction of KAT6A with PML and negatively regulates its acetylation activity towards p53/TP53. Phosphorylates palladin (PALLD), modulating cytoskeletal organization and cell motility. Phosphorylates prohibitin (PHB), playing an important role in cell metabolism and proliferation. Phosphorylates CDKN1A, for which phosphorylation at 'Thr-145' induces its release from CDK2 and cytoplasmic relocalization. These recent findings indicate that the AKT1 isoform has a more specific role in cell motility and proliferation. Phosphorylates CLK2 thereby controlling cell survival to ionizing radiation.
Description
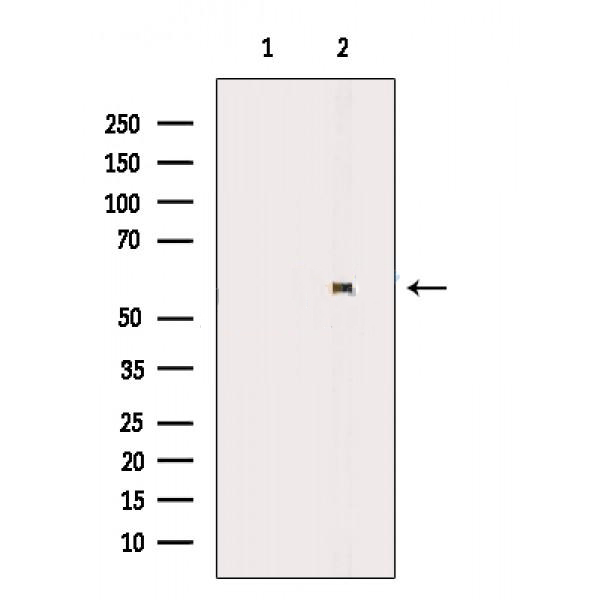
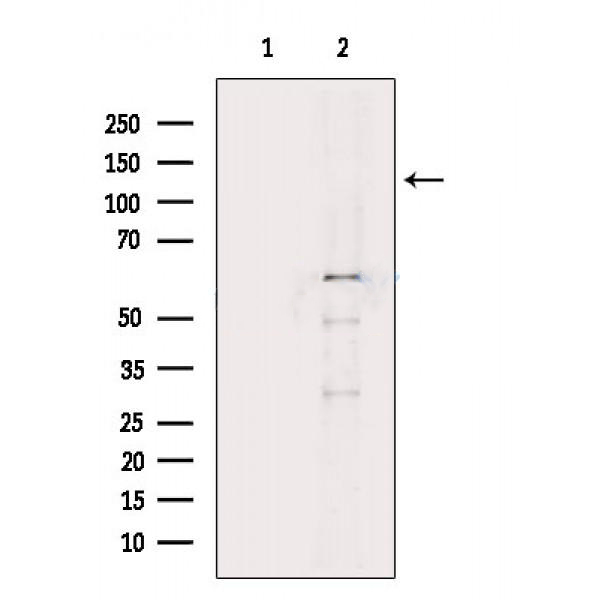
Rabbit polyclonal antibody to AKT1
Applications
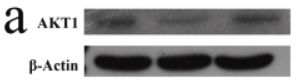
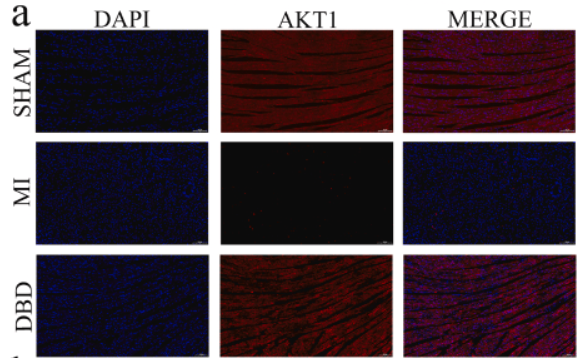
WB, IF, ICC.
Immunogen
AKT1 Antibody detects endogenous levels of total AKT1.
Reactivity
Human, Mouse, Rat.
可预测:Pig(100%), Zebrafish(%), Horse(%), Dog(%), Chicken(%), Xenopus(%)
Molecular weight
55kDa; 56kD(Calculated).
Host species
Rabbit
Ig class
Immunogen-specific rabbit IgG
Purification
Antigen affinity purification
Full name
AKT1
Synonyms
AKT 1; AKT1; AKT1_HUMAN; MGC99656; PKB; PKB-ALPHA; PRKBA; Protein Kinase B Alpha; Protein kinase B; Proto-oncogene c-Akt; RAC Alpha; RAC; RAC-alpha serine/threonine-protein kinase; RAC-PK-alpha;
Storage
Rabbit IgG in phosphate buffered saline , pH 7.4, 150mM NaCl, 0.02% sodium azide and 50% glycerol. Store at -20 °C. Stable for 12 months from date of receipt.
Swissprot
P31749


 产品订购:
产品订购:
 渠道电话:
渠道电话: