Actin-binding protein that enhances membrane ruffling and RAC activation. Enhances the actin-bundling activity of LCP1. Binds calcium. Plays a role in RAC signaling and in phagocytosis. May play a role in macrophage activation and function. Promotes the proliferation of vascular smooth muscle cells and of T-lymphocytes. Enhances lymphocyte migration. Plays a role in vascular inflammation.
Description
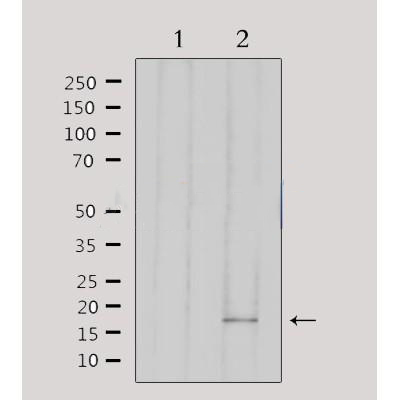
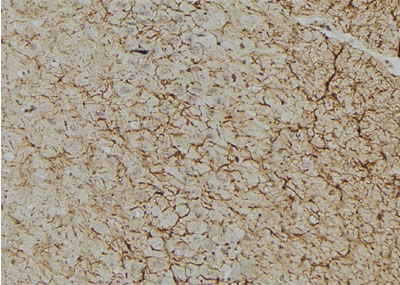
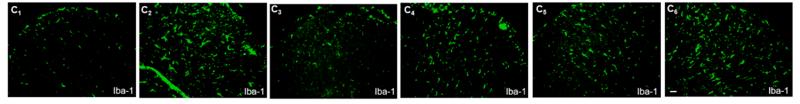
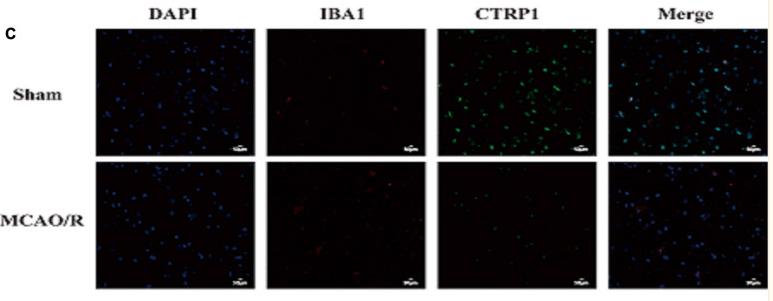
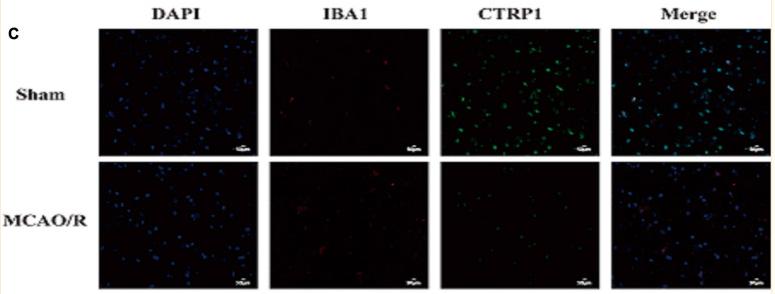
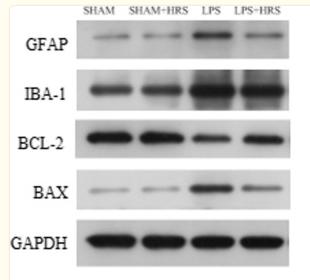
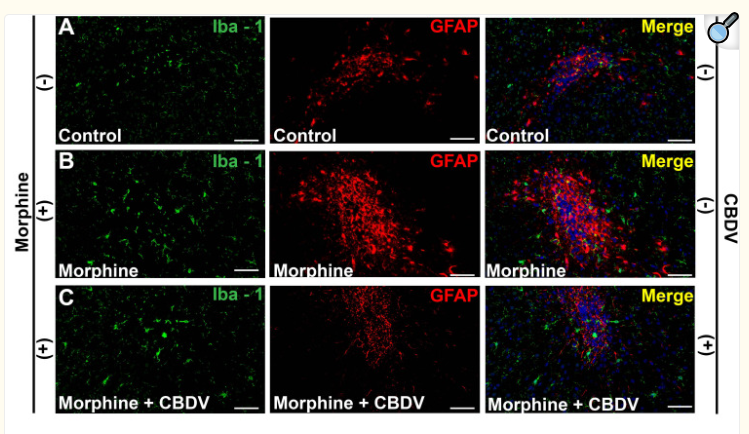
Rabbit polyclonal antibody to AIF1/IBA1
Applications
WB, IF, ICC, IHC.
Immunogen
AIF1/IBA1 Antibody detects endogenous levels of total AIF1/IBA1.
Reactivity
Human, Mouse, Rat.
可预测:Pig(100%), Bovine(%), Horse(%), Sheep(%), Rabbit(%), Dog(%)
Molecular weight
17kDa; 17kD(Calculated).
Host species
Rabbit
Ig class
Immunogen-specific rabbit IgG
Purification
Antigen affinity purification
Full name
AIF1/IBA1
Synonyms
AIF 1; AIF-1; Aif1; AIF1 protein; AIF1_HUMAN; Allograft inflammatory factor 1; Allograft inflammatory factor 1 splice variant G; allograft inflammatory factor-1 splice variant Hara-1; balloon angioplasty responsive transcription; BART 1; G1; G1 putative splice variant of allograft inflamatory factor 1; IBA 1; IBA1; interferon gamma responsive transcript; Interferon responsive transcript 1; interferon responsive transcript factor 1; Ionized calcium binding adapter molecule 1; Ionized calcium-binding adapter molecule 1; ionized calcium-binding adapter molecule; IRT 1; IRT1; Microglia response factor; MRF1; Protein g1;
Storage
Rabbit IgG in phosphate buffered saline , pH 7.4, 150mM NaCl, 0.02% sodium azide and 50% glycerol. Store at -20 °C. Stable for 12 months from date of receipt.
Swissprot
P55008


 产品订购:
产品订购:
 渠道电话:
渠道电话: