Mediates interactions of advanced glycosylation end products (AGE). These are nonenzymatically glycosylated proteins which accumulate in vascular tissue in aging and at an accelerated rate in diabetes. Acts as a mediator of both acute and chronic vascular inflammation in conditions such as atherosclerosis and in particular as a complication of diabetes. AGE/RAGE signaling plays an important role in regulating the production/expression of TNF-alpha, oxidative stress, and endothelial dysfunction in type 2 diabetes. Interaction with S100A12 on endothelium, mononuclear phagocytes, and lymphocytes triggers cellular activation, with generation of key proinflammatory mediators. Interaction with S100B after myocardial infarction may play a role in myocyte apoptosis by activating ERK1/2 and p53/TP53 signaling (By similarity). Receptor for amyloid beta peptide. Contributes to the translocation of amyloid-beta peptide (ABPP) across the cell membrane from the extracellular to the intracellular space in cortical neurons. ABPP-initiated RAGE signaling, especially stimulation of p38 mitogen-activated protein kinase (MAPK), has the capacity to drive a transport system delivering ABPP as a complex with RAGE to the intraneuronal space. Can also bind oligonucleotides.
Description
Rabbit polyclonal antibody to AGER/RAGE
Applications
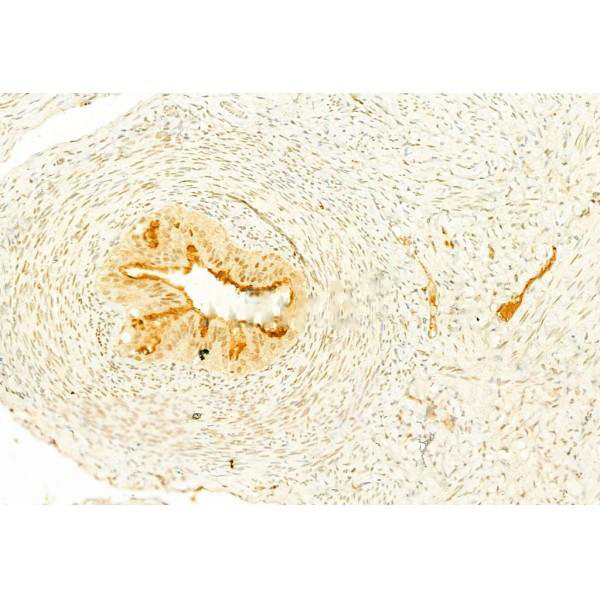
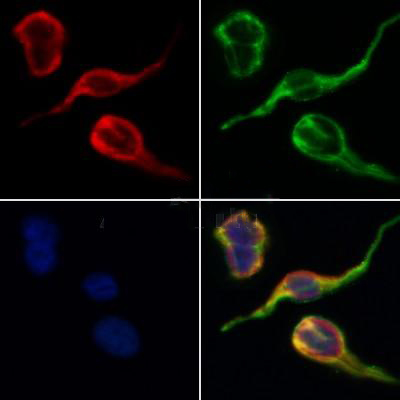
WB, IF, ICC, IHC
Immunogen
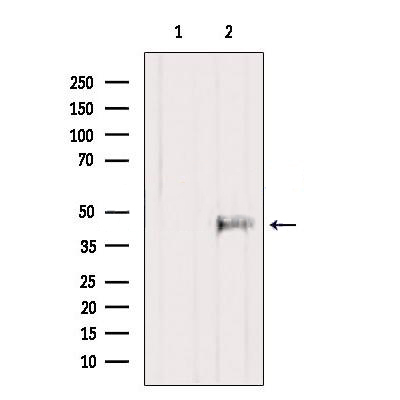
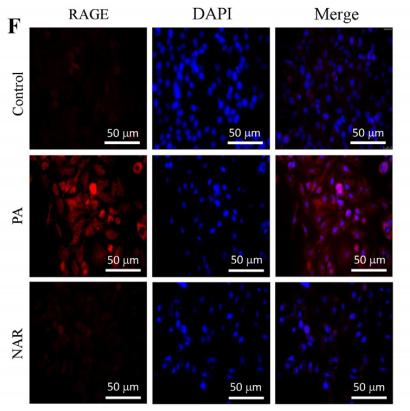
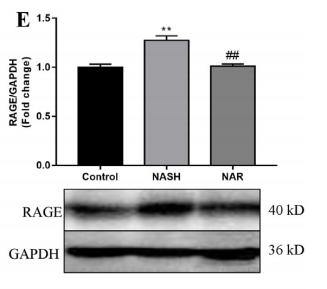
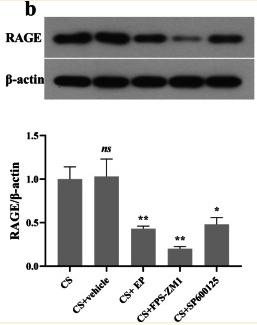
AGER/RAGE Antibody detects endogenous levels of total AGER/RAGE.
Reactivity
Human, Mouse, Rat.
可预测:Pig(92%), Bovine(%), Horse(%), Sheep(%), Rabbit(%), Dog(%)
Molecular weight
43~60kDa; 43kD(Calculated).
Host species
Rabbit
Ig class
Immunogen-specific rabbit IgG
Purification
Antigen affinity purification
Full name
AGER/RAGE
Synonyms
Advanced glycosylation end product-specific receptor; Ager; MGC2235; RAGE_HUMAN; Receptor for advanced glycosylation end products;
Storage
Rabbit IgG in phosphate buffered saline , pH 7.4, 150mM NaCl, 0.02% sodium azide and 50% glycerol. Store at -20 °C. Stable for 12 months from date of receipt.
Swissprot
Q15109


 产品订购:
产品订购:
 渠道电话:
渠道电话: