Cleaves the membrane-bound precursor of TNF-alpha to its mature soluble form. Responsible for the proteolytical release of soluble JAM3 from endothelial cells surface. Responsible for the proteolytic release of several other cell-surface proteins, including p75 TNF-receptor, interleukin 1 receptor type II, p55 TNF-receptor, transforming growth factor-alpha, L-selectin, growth hormone receptor, MUC1 and the amyloid precursor protein. Acts as an activator of Notch pathway by mediating cleavage of Notch, generating the membrane-associated intermediate fragment called Notch extracellular truncation (NEXT). Plays a role in the proteolytic processing of ACE2. Plays a role in hemostasis through shedding of GP1BA, the platelet glycoprotein Ib alpha chain (By similarity). Mediates the proteolytic cleavage of LAG3, leading to release the secreted form of LAG3 (By similarity).
Description
Rabbit polyclonal antibody to ADAM 17
Applications
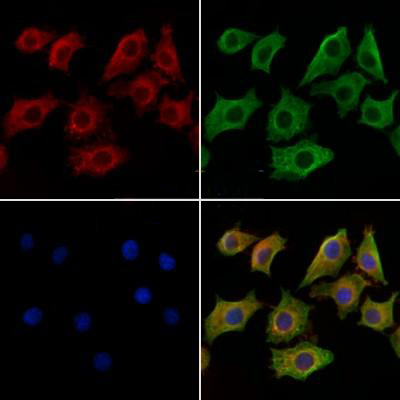
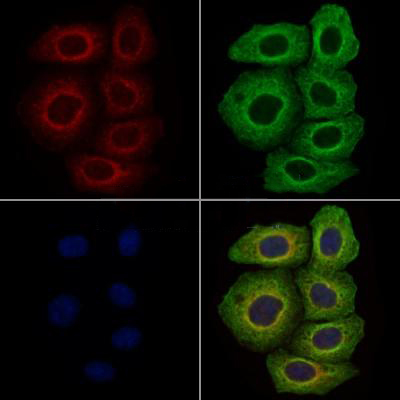
WB, IF, ICC.
Immunogen
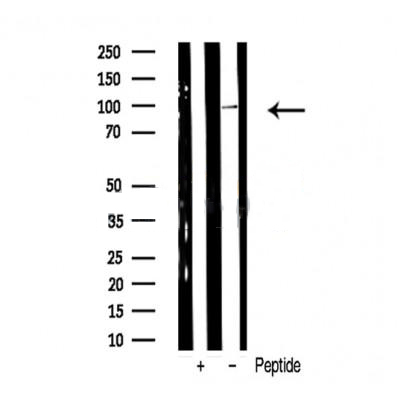
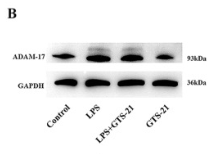
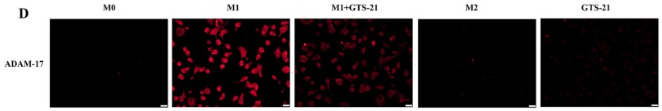
ADAM 17 Antibody detects endogenous levels of total ADAM 17.
Reactivity
Human, Mouse, Rat.
可预测:Bovine(100%), Horse(100%), Sheep(100%), Dog(100%)
Molecular weight
93 kDa; 93kD(Calculated).
Host species
Rabbit
Ig class
Immunogen-specific rabbit IgG
Purification
Antigen affinity purification
Full name
ADAM 17
Synonyms
A disintegrin and metalloproteinase domain 17 (tumor necrosis factor, alpha, converting enzyme); A disintegrin and metalloproteinase domain 17; ADA17_HUMAN; ADAM 17; ADAM metallopeptidase domain 17; ADAM17; ADAM17 protein; CD 156b; CD156b; CD156b antigen; CSVP; Disintegrin and metalloproteinase domain-containing protein 17; MGC71942; NISBD; NISBD1; Snake venom like protease; Snake venom-like protease; TACE; TNF alpha convertase; TNF alpha converting enzyme; TNF-alpha convertase; TNF-alpha-converting enzyme; Tumor Necrosis Factor Alpha Converting Enzyme;
Storage
Rabbit IgG in phosphate buffered saline , pH 7.4, 150mM NaCl, 0.02% sodium azide and 50% glycerol. Store at -20 °C. Stable for 12 months from date of receipt.
Swissprot
P78536


 产品订购:
产品订购:
 渠道电话:
渠道电话: