Catalyzes the desaturation of acyl-CoAs to 2-trans-enoyl-CoAs. Isoform 1 shows highest activity against medium-chain fatty acyl-CoAs and activity decreases with increasing chain length. Isoform 2 is active against a much broader range of substrates and shows activity towards very long-chain acyl-CoAs. Isoform 2 is twice as active as isoform 1 against 16-hydroxy-palmitoyl-CoA and is 25% more active against 1,16-hexadecanodioyl-CoA.
Description
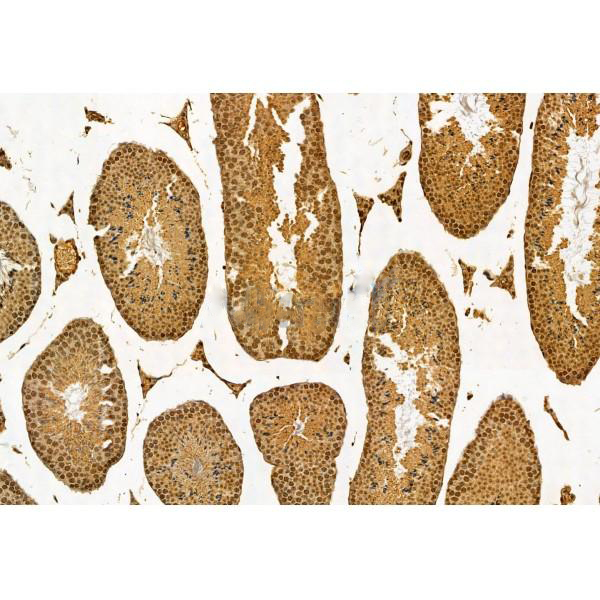
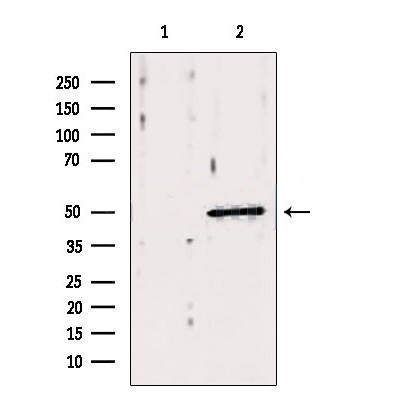
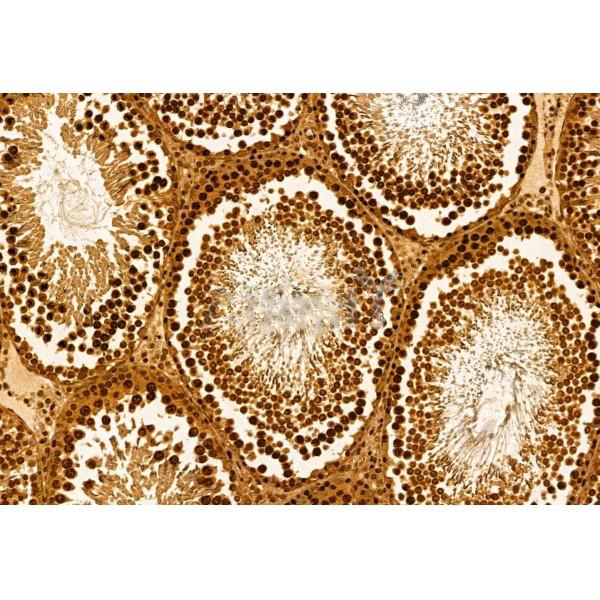
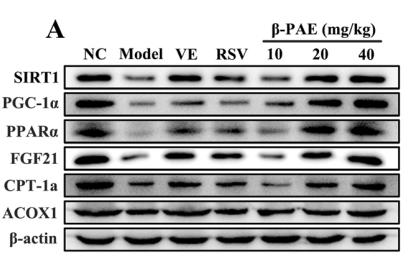
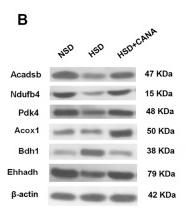
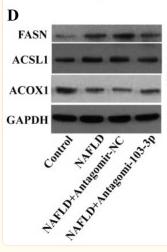
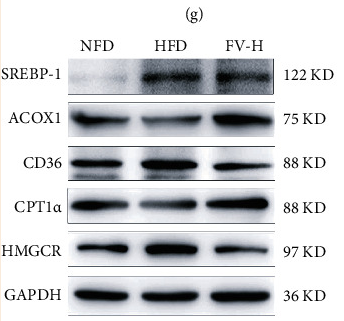
Rabbit polyclonal antibody to ACOX1
Applications
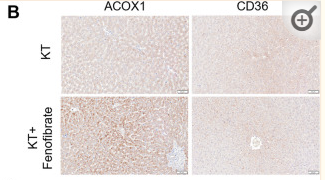
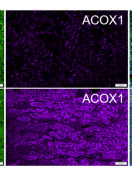
WB, IHC.
Immunogen
ACOX1 Antibody detects endogenous levels of total ACOX1.
Reactivity
Human, Mouse, Rat.
可预测:Pig(100%), Bovine(100%), Horse(100%), Sheep(100%), Rabbit(100%), Dog(92%)
Molecular weight
50 kDa; 74kD(Calculated).
Host species
Rabbit
Ig class
Immunogen-specific rabbit IgG
Purification
Antigen affinity purification
Full name
ACOX1
Synonyms
ACOX; ACOX1; ACOX1_HUMAN; Acyl CoA oxidase 1 palmitoyl; Acyl CoA oxidase straight chain; AOX; EC 1.3.3.6; PALMCOX; Palmitoyl CoA oxidase; Palmitoyl-CoA oxidase; Peroxisomal acyl coenzyme A oxidase 1; Peroxisomal acyl-coenzyme A oxidase 1; Peroxisomal fatty acyl CoA oxidase; SCOX; Straight chain acyl CoA oxidase; Straight-chain acyl-CoA oxidase;
Storage
Rabbit IgG in phosphate buffered saline , pH 7.4, 150mM NaCl, 0.02% sodium azide and 50% glycerol. Store at -20 °C. Stable for 12 months from date of receipt.
Swissprot
Q15067


 产品订购:
产品订购:
 渠道电话:
渠道电话: