NF-kappa-B is a pleiotropic transcription factor present in almost all cell types and is the endpoint of a series of signal transduction events that are initiated by a vast array of stimuli related to many biological processes such as inflammation, immunity, differentiation, cell growth, tumorigenesis and apoptosis. NF-kappa-B is a homo- or heterodimeric complex formed by the Rel-like domain-containing proteins RELA/p65, RELB, NFKB1/p105, NFKB1/p50, REL and NFKB2/p52. The heterodimeric RELA-NFKB1 complex appears to be most abundant one. The dimers bind at kappa-B sites in the DNA of their target genes and the inpidual dimers have distinct preferences for different kappa-B sites that they can bind with distinguishable affinity and specificity. Different dimer combinations act as transcriptional activators or repressors, respectively. The NF-kappa-B heterodimeric RELA-NFKB1 and RELA-REL complexes, for instance, function as transcriptional activators. NF-kappa-B is controlled by various mechanisms of post-translational modification and subcellular compartmentalization as well as by interactions with other cofactors or corepressors. NF-kappa-B complexes are held in the cytoplasm in an inactive state complexed with members of the NF-kappa-B inhibitor (I-kappa-B) family. In a conventional activation pathway, I-kappa-B is phosphorylated by I-kappa-B kinases (IKKs) in response to different activators, subsequently degraded thus liberating the active NF-kappa-B complex which translocates to the nucleus. The inhibitory effect of I-kappa-B on NF-kappa-B through retention in the cytoplasm is exerted primarily through the interaction with RELA. RELA shows a weak DNA-binding site which could contribute directly to DNA binding in the NF-kappa-B complex. Beside its activity as a direct transcriptional activator, it is also able to modulate promoters accessibility to transcription factors and thereby indirectly regulate gene expression. Associates with chromatin at the NF-kappa-B promoter region via association with DDX1. Essential for cytokine gene expression in T-cells. The NF-kappa-B homodimeric RELA-RELA complex appears to be involved in invasin-mediated activation of IL-8 expression.
Description
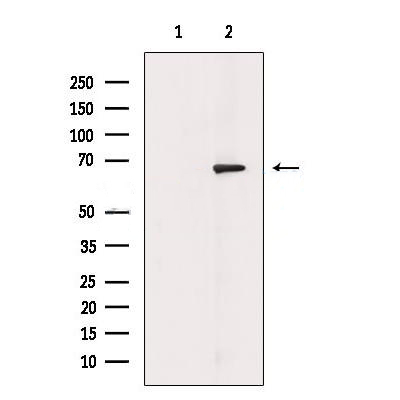
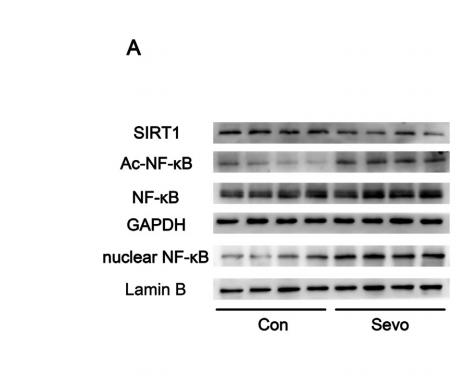
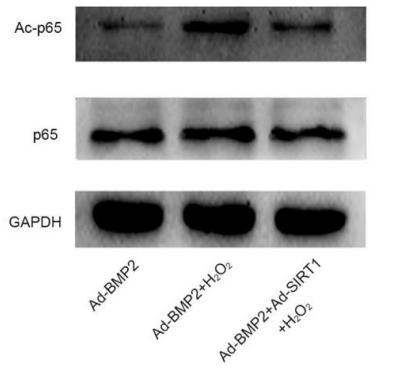
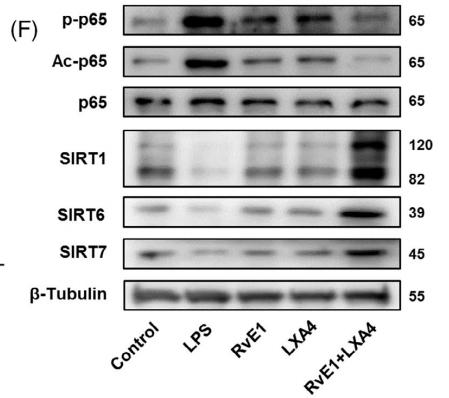
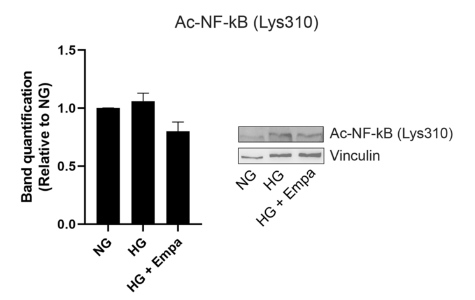
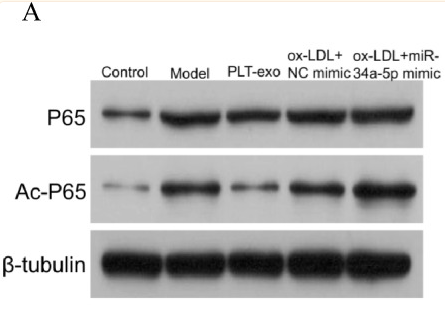
Rabbit polyclonal antibody to Acetyl-NF-kappaB p65 (Lys310)
Applications
WB, IF, ICC, IHC
Immunogen
Acetyl-NF-kappaB p65 (Lys310) Antibody detects endogenous levels of Acetyl-NF-kappaB p65 only when acetylated at Lys310.
Reactivity
Human, Mouse, Rat.
可预测:Pig(100%), Bovine(100%), Horse(100%), Sheep(100%), Dog(100%)
Molecular weight
65 KD; 60kD(Calculated).
Host species
Rabbit
Ig class
Immunogen-specific rabbit IgG
Purification
Antigen affinity purification
Full name
Acetyl-NF-kappaB p65 (Lys310)
Synonyms
Avian reticuloendotheliosis viral (v rel) oncogene homolog A; MGC131774; NF kappa B p65delta3; NFKB3; Nuclear Factor NF Kappa B p65 Subunit; Nuclear factor NF-kappa-B p65 subunit; Nuclear factor of kappa light polypeptide gene enhancer in B cells 3; Nuclear factor of kappa light polypeptide gene enhancer in B-cells 3; OTTHUMP00000233473; OTTHUMP00000233474; OTTHUMP00000233475; OTTHUMP00000233476; OTTHUMP00000233900; p65; p65 NF kappaB; p65 NFkB; relA; TF65_HUMAN; Transcription factor p65; v rel avian reticuloendotheliosis viral oncogene homolog A (nuclear factor of kappa light polypeptide gene enhancer in B cells 3 (p65)); V rel avian reticuloendotheliosis viral oncogene homolog A; v rel reticuloendotheliosis viral oncogene homolog A (avian); V rel reticuloendotheliosis viral oncogene homolog A, nuclear factor of kappa light polypeptide gene enhancer in B cells 3, p65;
Storage
Rabbit IgG in phosphate buffered saline , pH 7.4, 150mM NaCl. Store at -20 °C. Stable for 12 months from date of receipt.
Swissprot
Q04206


 产品订购:
产品订购:
 渠道电话:
渠道电话: