Cytosolic enzyme that catalyzes the carboxylation of acetyl-CoA to malonyl-CoA, the first and rate-limiting step of de novo fatty acid biosynthesis. This is a 2 steps reaction starting with the ATP-dependent carboxylation of the biotin carried by the biotin carboxyl carrier (BCC) domain followed by the transfer of the carboxyl group from carboxylated biotin to acetyl-CoA.
Description
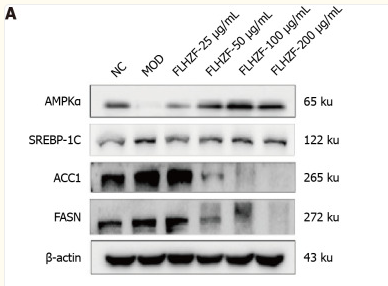
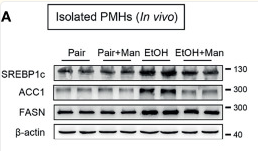
Rabbit polyclonal antibody to ACC1
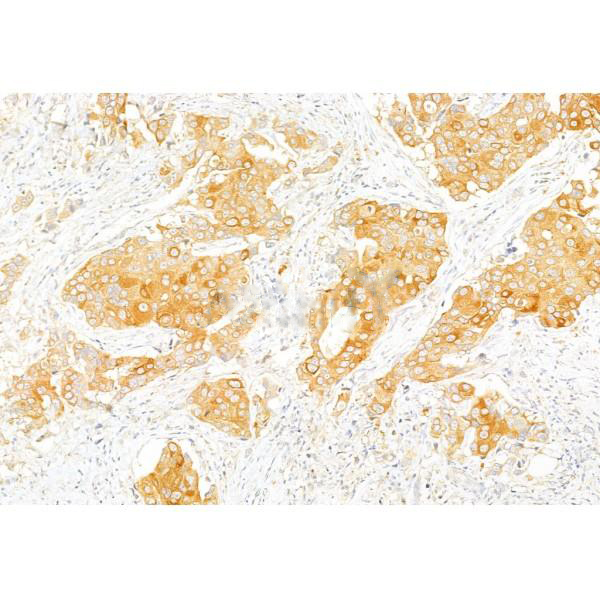
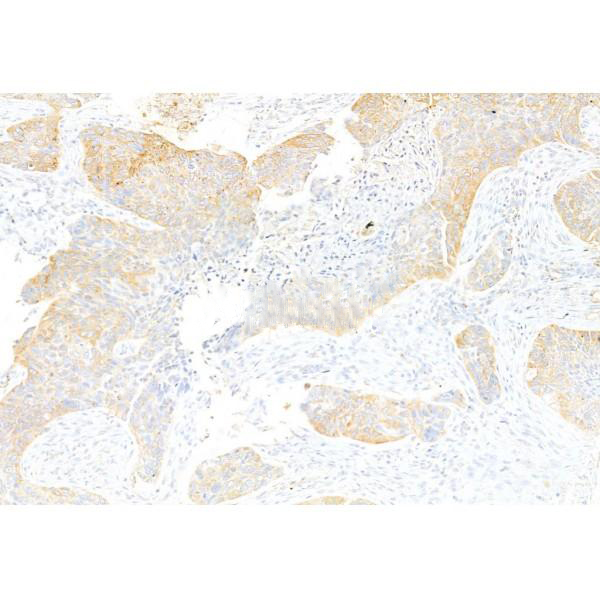
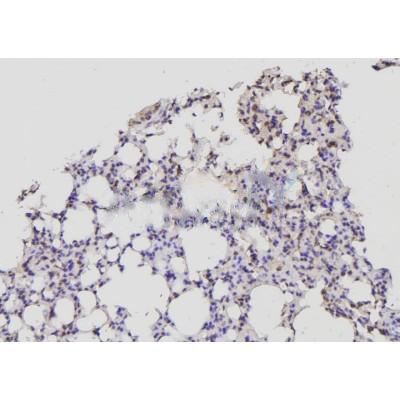
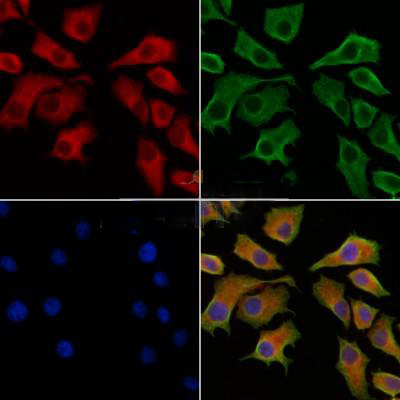
Applications
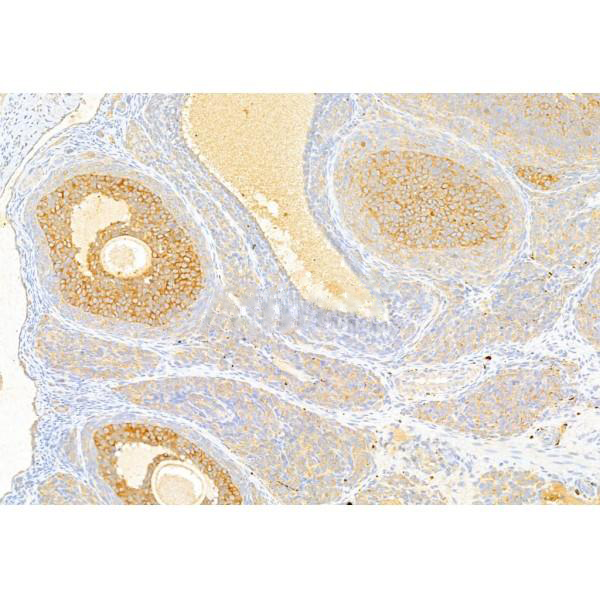
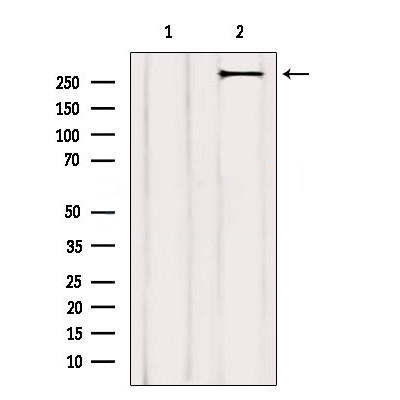
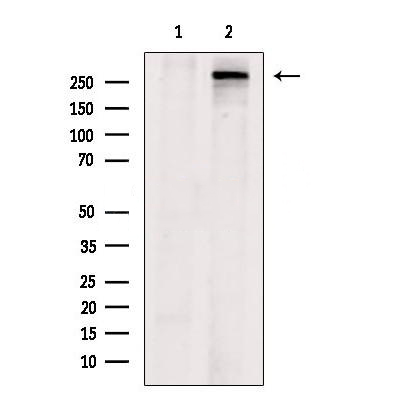
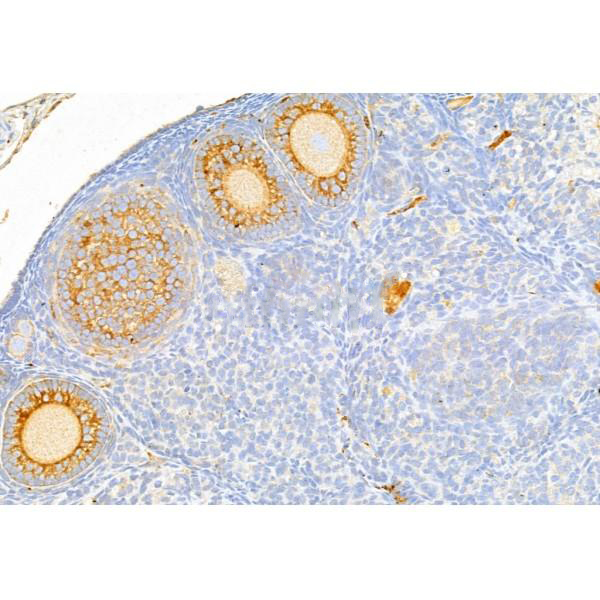
WB, IF, ICC, IHC
Immunogen
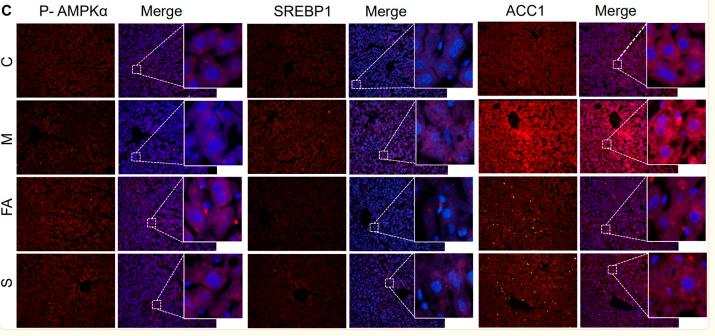
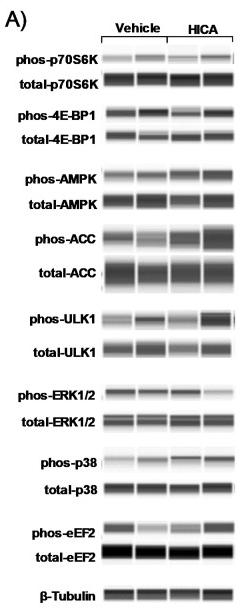
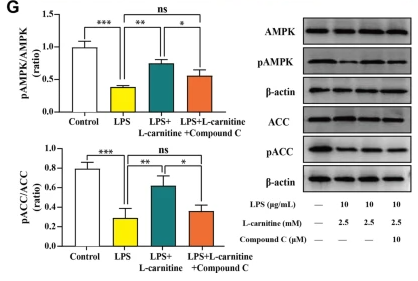
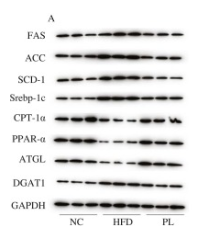
ACC1 Antibody detects endogenous levels of total ACC1.
Reactivity
Human, Mouse, Rat.
可预测:Pig(100%), Zebrafish(85%), Bovine(100%), Horse(92%), Sheep(100%), Rabbit(92%), Dog(100%), Chicken(80%)
Molecular weight
265kDa; 266kD(Calculated).
Host species
Rabbit
Ig class
Immunogen-specific rabbit IgG
Purification
Antigen affinity purification
Full name
ACC1
Synonyms
ACAC;ACACA;ACACA_HUMAN;ACC alpha;ACC 1;ACC-alpha;ACC1;ACCA;Acetyl CoA carboxylase 1;Acetyl CoA carboxylase alpha;Acetyl Coenzyme A carboxylase alpha;Biotin carboxylase;COA1;HACC275 antibody;
Storage
Rabbit IgG in phosphate buffered saline , pH 7.4, 150mM NaCl, 0.02% sodium azide and 50% glycerol. Store at -20 °C. Stable for 12 months from date of receipt.
Swissprot
Q13085


 产品订购:
产品订购:
 渠道电话:
渠道电话: