G-protein coupled receptor for 5-hydroxytryptamine (serotonin). Also functions as a receptor for various drugs and psychoactive substances. Ligand binding causes a conformation change that triggers signaling via guanine nucleotide-binding proteins (G proteins) and modulates the activity of down-stream effectors, such as adenylate cyclase. Beta-arrestin family members inhibit signaling via G proteins and mediate activation of alternative signaling pathways. Signaling inhibits adenylate cyclase activity and activates a phosphatidylinositol-calcium second messenger system that regulates the release of Ca(2+) ions from intracellular stores. Plays a role in the regulation of 5-hydroxytryptamine release and in the regulation of dopamine and 5-hydroxytryptamine metabolism. Plays a role in the regulation of dopamine and 5-hydroxytryptamine levels in the brain, and thereby affects neural activity, mood and behavior. Plays a role in the response to anxiogenic stimuli.
Description
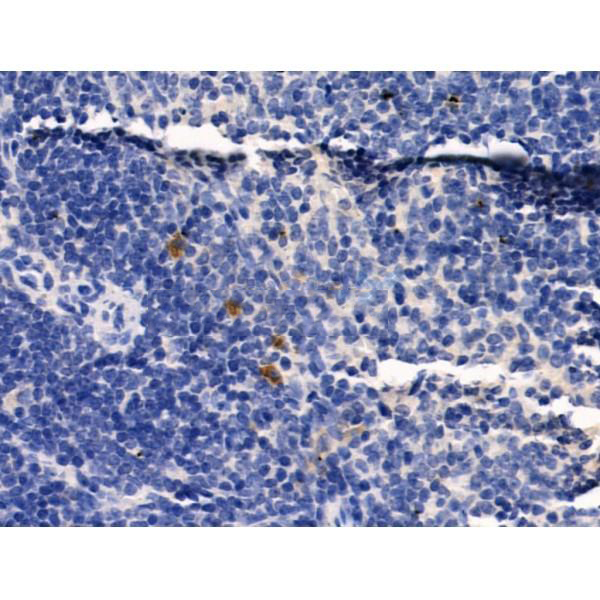
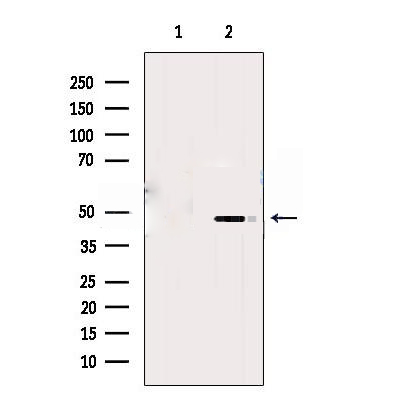
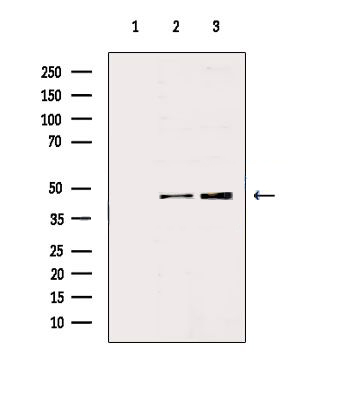
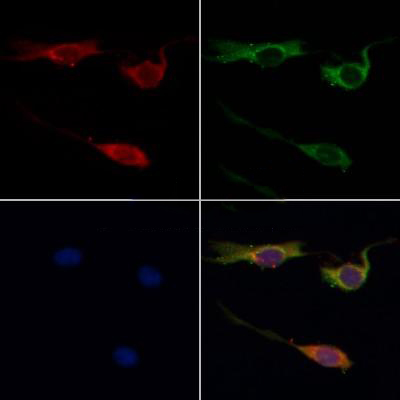
Rabbit polyclonal antibody to 5HT1A Receptor
Applications
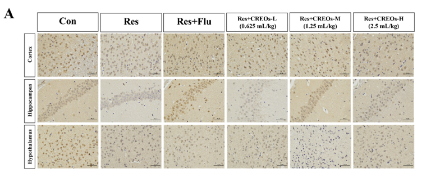
WB, IF, ICC, IHC, IHC-p
Immunogen
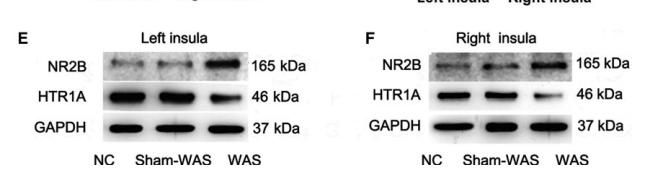
5HT1A Receptor Antibody detects endogenous levels of total 5HT1A Receptor.
Reactivity
Human, Mouse, Rat.
可预测:Pig(100%), Zebrafish(91%), Bovine(100%), Horse(100%), Sheep(100%), Rabbit(100%), Dog(100%), Chicken(100%), Xenopus(100%)
Molecular weight
46 kDa; 46kD(Calculated).
Host species
Rabbit
Ig class
Immunogen-specific rabbit IgG
Purification
Antigen affinity purification
Full name
5HT1A Receptor
Synonyms
5 HT 1A; 5 HT receptor 1A; 5 HT1A; 5 HT1A receptor; 5 hydroxytryptamine (serotonin) receptor 1A; 5 hydroxytryptamine (serotonin) receptor 1A G protein coupled; 5 hydroxytryptamine receptor 1A; 5-HT-1A; 5-HT1A; 5-hydroxytryptamine receptor 1A; 5HT 1A; 5HT 1A receptor; 5HT receptor 1A; 5HT1a; 5HT1A_HUMAN; ADRB2RL1; ADRBRL1; G 21; G protein coupled receptor; G-21; Gpcr 18; Gpcr18; Guanine nucleotide binding regulatory protein-coupled receptor; Htr1a; PFMCD; Serotonin 1A receptor; Serotonin 5HT1A receptor; Serotonin receptor 1A;
Storage
Rabbit IgG in phosphate buffered saline , pH 7.4, 150mM NaCl, 0.02% sodium azide and 50% glycerol. Store at -20 °C. Stable for 12 months from date of receipt.
Swissprot
P08908


 产品订购:
产品订购:
 渠道电话:
渠道电话: