您现在的位置:
ab11607 4E-BP1 Antibody
货号:
实验方法:WB,IF,ICC
实验种属:Human,Mouse,Rat,Rabbit,Bovine,Chicken,Dog,Sheep,Horse
宿主种属:Rabbit
共轭标记:Unconjugated
产品售价:
产品订购:
jiamay@gmail.com
渠道电话:
+86 400-698-4168
客服电话:
+86 400-698-4168
下载说明书
产品详情
产品应用信息
Repressor of translation initiation that regulates EIF4E activity by preventing its assembly into the eIF4F complex: hypophosphorylated form competes with EIF4G1/EIF4G3 and strongly binds to EIF4E, leading to repress translation. In contrast, hyperphosphorylated form dissociates from EIF4E, allowing interaction between EIF4G1/EIF4G3 and EIF4E, leading to initiation of translation. Mediates the regulation of protein translation by hormones, growth factors and other stimuli that signal through the MAP kinase and mTORC1 pathways.

Description
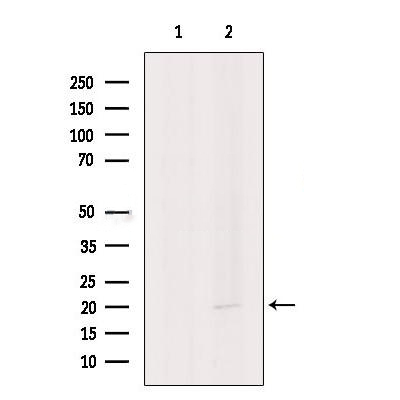
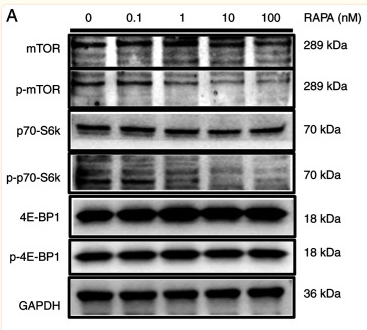
Rabbit polyclonal antibody to 4E-BP1

Applications 
WB, IF, ICC, IHC

Immunogen 
4E-BP1 Antibody detects endogenous levels of total 4E-BP1.

Reactivity 
Human, Mouse, Rat.
可预测:Pig(100%), Zebrafish(100%), Bovine(100%), Horse(100%), Sheep(100%), Rabbit(100%), Dog(100%), Chicken(82%)

Molecular weight
18kDa; 13kD(Calculated).

Host species 
Rabbit

Ig class 
Immunogen-specific rabbit IgG

Purification 
Antigen affinity purification

Full name 
4E-BP1

Synonyms 
4E-BP1; 4EBP1; 4EBP1_HUMAN; BP 1; eIF4E binding protein 1; eIF4E-binding protein 1; Eif4ebp1; Eukaryotic translation initiation factor 4E-binding protein 1; PHAS-I; PHASI; Phosphorylated heat- and acid-stable protein regulated by insulin 1;

Storage
Rabbit IgG in phosphate buffered saline , pH 7.4, 150mM NaCl, 0.02% sodium azide and 50% glycerol. Store at -20 °C. Stable for 12 months from date of receipt.

Swissprot 
Q13541


图片数据
Western blot analysis of extracts from MCF7, using 4E-BP1 Antibody. The lane on the left was treated with blocking peptide....
Figure 5. Effect of fluoxetine (20mg/kg) and rapamycin (10mg/kg) on the level of phosphorylated-4E-BP-1 expression in the frontal cortex (A), the hippocampus (B), the amygdala (C) and the hypothalamus (D). The data represented the values of mean± S.E.M. from 5mice/group. # P< 0.05 and ##P< 0.01 vs Control-vehicle group. *P< 0.05 and **P< 0.01 vs CUMS-vehicle group. +P< 0.05 vs CUMS-fluoxetine group. The results of Two-way ANOVA are provided in supplemental materials....
Fig. 4. |The effect of PA on the level of expression of p-4E-BP-1 protein in the hippocampus. (A) The effect of PA on p-4E-BP-1 and 4E-BP-1 protein levels in hippocampus were investigated by western blot analysis....
Figure 2 The effects of HICA on the intracellular signaling pathways. A typical image for a capillary immunoassay is shown (A). The phosphorylation levels of (B) p70S6K and 4E-BP1; (C) AMPK, ACC, and ULK1; (D) ERK1/2; (E) p38MAPK; and (F) eEF2 are shown. The phosphorylation is normalized to the total protein expression. The β-tubulin content in the lysate was measured as a loading control (G). The time course of these experiments is shown in the upper region. DM: differentiation medium, DMEM: Dulbecco’s modified Eagle’s medium, and w/o AA: without amino acids. Data are displayed as the means ± SD, and n = 4 for each group in all bar graphs. * p < 0.05 and ** p < 0.01 vs. the vehicle-treated group....
Figure 3 Expression levels of mTOR pathway proteins, ERS-associated proteins, and apoptosis-associated proteins in WT, CLP, and CLP+4-PBA mouse groups. After purifying the CD4+ T cells from mouse spleen lymphocytes, whole cell lysates were assessed for the protein expression of (a) patterns of mTOR pathway proteins, including mTOR, P-mTOR, downstream effectors p70s6k, p-p70s6k, 4EBP, and P-4EBP; (b) ERS-associated proteins, including GRP78 and CHOP; (c) apoptosis-associated proteins, including caspase-3, Bax, and Bcl-2. The protein expression was detected by immunoblotting. Data are mean ± SD. n = 4 biologically independent experiments (one-way ANOVA Tukey...
Figure 5. RAPA inhibits the mTOR/p70-S6k signaling pathway in B16 cells. B16 cells were treated with 0, 1, 10 and 100 nM RAPA for 48 h. (A) Western blotting results showed that RAPA inhibited the expression of p-mTOR and p-p70-S6k compared with in the control group. Statistical analysis of the (B) p-mTOR/mTOR ratio, (C) the p-p70-S6k/p70-S6k ratio and (D) the p-4E-BP1/4E-BP1 ratio at the protein level. Data are presented as the mean ± SD (n=3). *P...

嘉美客服微信